 2Q-Solution
Modern finance teams are expected to deliver faster closes, deeper analysis, and consistent numbers across stakeholders. Excel remains the most practical tool in many organisations because it is flexible, widely adopted, and integrates well with structured data sources. However, traditional workbook approaches break down when reporting becomes complex, multi-entity, and time-sensitive. By combining Power Pivot, DAX, and VBA, you can turn Excel into a lightweight BI system for reliable, automated financial reporting. This is also a core capability many learners aim to build through a data analyst course in Delhi when they want job-ready reporting and automation skills.
Why traditional Excel reporting fails at scale
Most reporting problems start with good intentions: one file, a few sheets, some formulas, and a PivotTable. Over time, the workbook grows into a fragile system with repeated data copies, hard-coded logic, and inconsistent definitions of metrics like “Revenue”, “Gross Margin”, or “Operating Cost”. Common failure points include:
- Multiple versions of “truth” across teams due to manual copy-paste.
- Complex SUMIFS chains that become slow and difficult to audit.
- PivotTables tied to flat tables without a clear data model.
- Month-end updates that rely on a single person who understands the logic.
The advanced approach is to move from “spreadsheet thinking” to “data model thinking”. Power Pivot, DAX measures, and VBA automation work together to make reporting stable, traceable, and refreshable.
Building a scalable data model with Power Pivot
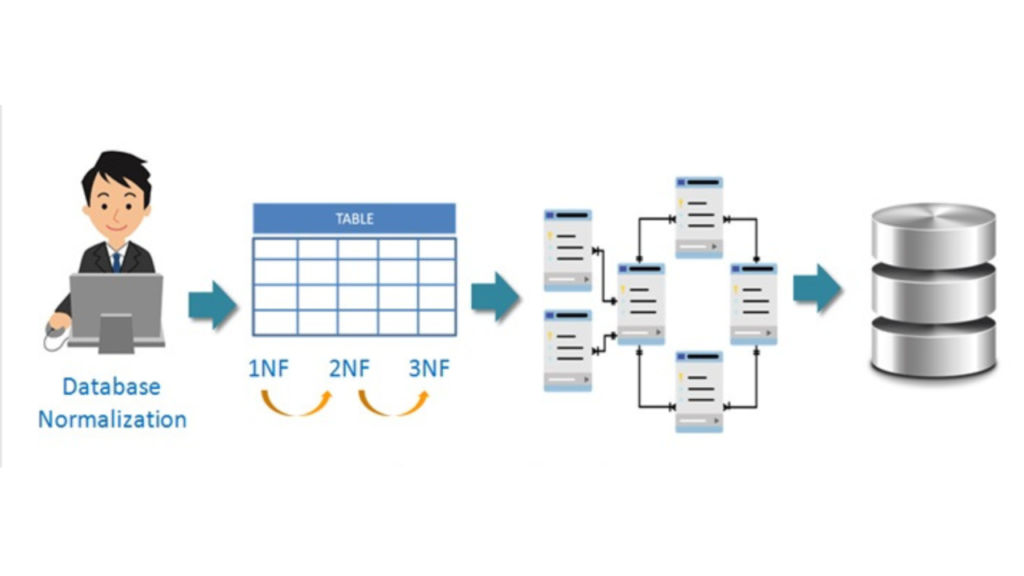
Power Pivot is the foundation for Excel-based BI because it enables a proper data model inside the workbook. Instead of building reports directly on raw tables, you create a model that behaves like a mini data warehouse.
Design for grain and relationships
Start by defining the “grain” of each fact table. For example:
- Sales fact at invoice-line level
- Cost fact at product-month level
- Payroll fact at department-month level
Then create dimension tables such as Date, Product, Customer, Entity, Cost Centre, and Chart of Accounts. Your goal is a star schema where fact tables connect to shared dimensions through keys. This structure prevents double counting and makes your P&L, cash flow, and variance reports more consistent.
Use clean, standardised inputs
While Power Pivot handles the model, you still need reliable inputs. Ensure columns have consistent data types, keys are unique in dimension tables, and date fields are properly populated. If your source data is messy, use Power Query to standardise it before loading to the model, then keep the transformation steps documented.
Mastering DAX for financial reporting measures
DAX is where financial logic becomes reusable and consistent. Instead of embedding calculations inside cells, you define measures once and use them across multiple pivots, charts, and dashboards.
Create base measures first
A strong DAX setup begins with base measures such as:
- Total Revenue
- Total Cost
- Total Quantity
- Total Operating Expense
These should be simple aggregations tied to the correct fact table. Once base measures are stable, layer higher-level measures like Gross Margin, EBITDA, Contribution Margin, and Budget vs Actual.
Handle time intelligence correctly
Finance reporting is time-driven. Use a dedicated Date table marked as the Date Table in the model. Then build measures for:
- Month-to-date and year-to-date totals
- Prior month and prior year comparisons
- Rolling 3-month or 12-month trends
This approach enables consistent period comparisons across entities and departments without rewriting formulas for each report view. Professionals often practise these patterns in a data analyst course in Delhi because time intelligence is a frequent interview and workplace requirement.
Avoid common DAX errors
DAX is powerful but sensitive to context. Common mistakes include:
- Using calculated columns where measures are needed
- Ignoring filter context changes caused by slicers
- Mixing row-level and aggregate logic without clarity
A practical technique is to validate each measure against a controlled PivotTable and a small test dataset. When measures match expectations, scale them to the full model.
Using VBA to automate refresh, output, and distribution
Once your model and measures are stable, VBA can automate repetitive reporting steps. This is especially useful for month-end packs and scheduled stakeholder updates.
Automate refresh and report preparation
A well-structured macro can:
- Refresh all Power Query connections
- Refresh the Power Pivot data model
- Update PivotTables and slicers
- Recalculate dependent sheets
- Apply consistent formatting for print-ready output
Add basic error handling and logging so the process is auditable. For example, log refresh start time, end time, and success or failure status to a hidden “Run Log” sheet.
Generate deliverables consistently
VBA can export specific sheets to PDF, save them with a naming convention like “Entity_Month_Year_Report.pdf”, and place outputs in a controlled folder. It can also prepare email drafts for distribution. Even if your organisation later migrates to enterprise BI tools, this capability delivers immediate value in Excel-heavy environments.
Governance and performance for audit-ready reporting
Advanced reporting is not only about speed. It must be defensible and easy to review.
- Document measure definitions and business rules in a “Metric Dictionary” tab.
- Separate inputs, model, and outputs to reduce accidental edits.
- Use reconciliation checks: totals by entity, month, and account should match source extracts.
- Optimise model size by removing unused columns and avoiding high-cardinality text fields where possible.
This ensures your reporting is repeatable, consistent, and aligned with finance controls.
Conclusion
Excel can deliver serious BI outcomes when you treat it like a modelling and automation platform rather than a manual spreadsheet. Power Pivot provides the structure, DAX provides consistent financial logic, and VBA removes repetitive effort from refresh and distribution. When combined, they create an efficient workflow for complex financial reporting that scales across entities, time periods, and stakeholder needs. If you are building these capabilities for real projects and career growth, a data analyst course in Delhi often aligns well with mastering this exact blend of modelling, measure design, and automation.
Read More at Gorod